![]()
![]()
View and Annotate Images
Introduction
Once images have been added to a project, one can easily view them without leaving Flywheel. The integrated viewer can load full studies and allows you to add annotation, ROIs labels, or segmentation overlays to the images.
This article is an overview of how to navigate Flywheel's DICOM and NIFTI image viewer as well as how to add ROIs, annotations, measurements, and segmentations.
Instruction Steps
Why use Flywheel to work with images?
All measurements, annotations, ROIs and their associated labels are stored as custom metadata. Like all metadata in Flywheel, measurement and ROI data is indexed. This means you can search on this field in Advanced Search or group data based on this field to create a collection.
V3 infrastructure Required
The features described in this article require Flywheel's V3 infrastructure. See if your site is using V3.
Flywheel sites using V2 infrastructure also have an integrated OHIF viewer, which includes the default OHIF features without the customizations described in this article. See the section below for how to add an ROI on V2 infrastructure.
View an Image

Launch the viewer by selecting the OHIF icon  from the following places in Flywheel:
- The Project page:

- The Sessions panel:
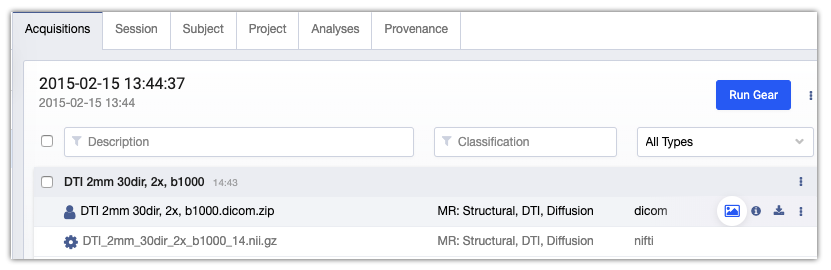
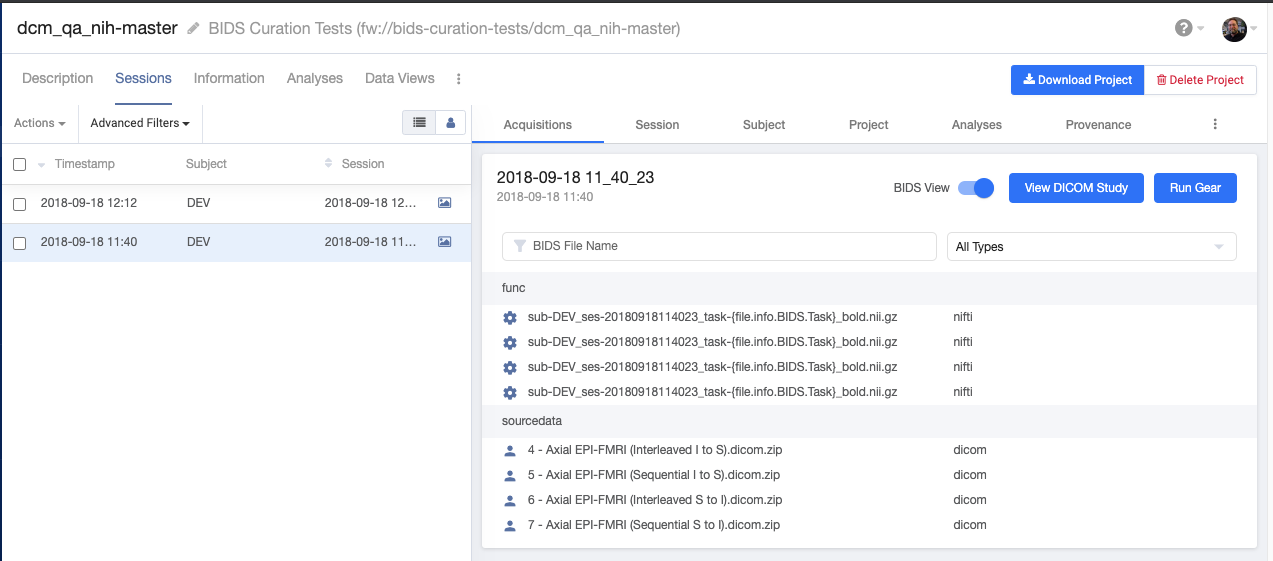 3. The Acquisitions tab:
Navigating Between Sessions
This feature is currently only available for DICOM files.
- When opening the viewer from the Project, the full list of sessions is displayed.

When you open the viewer from the session or acquisition, you are taken to that specific session or acquisition.
Click Study List in the top menu to view all studies within the project.
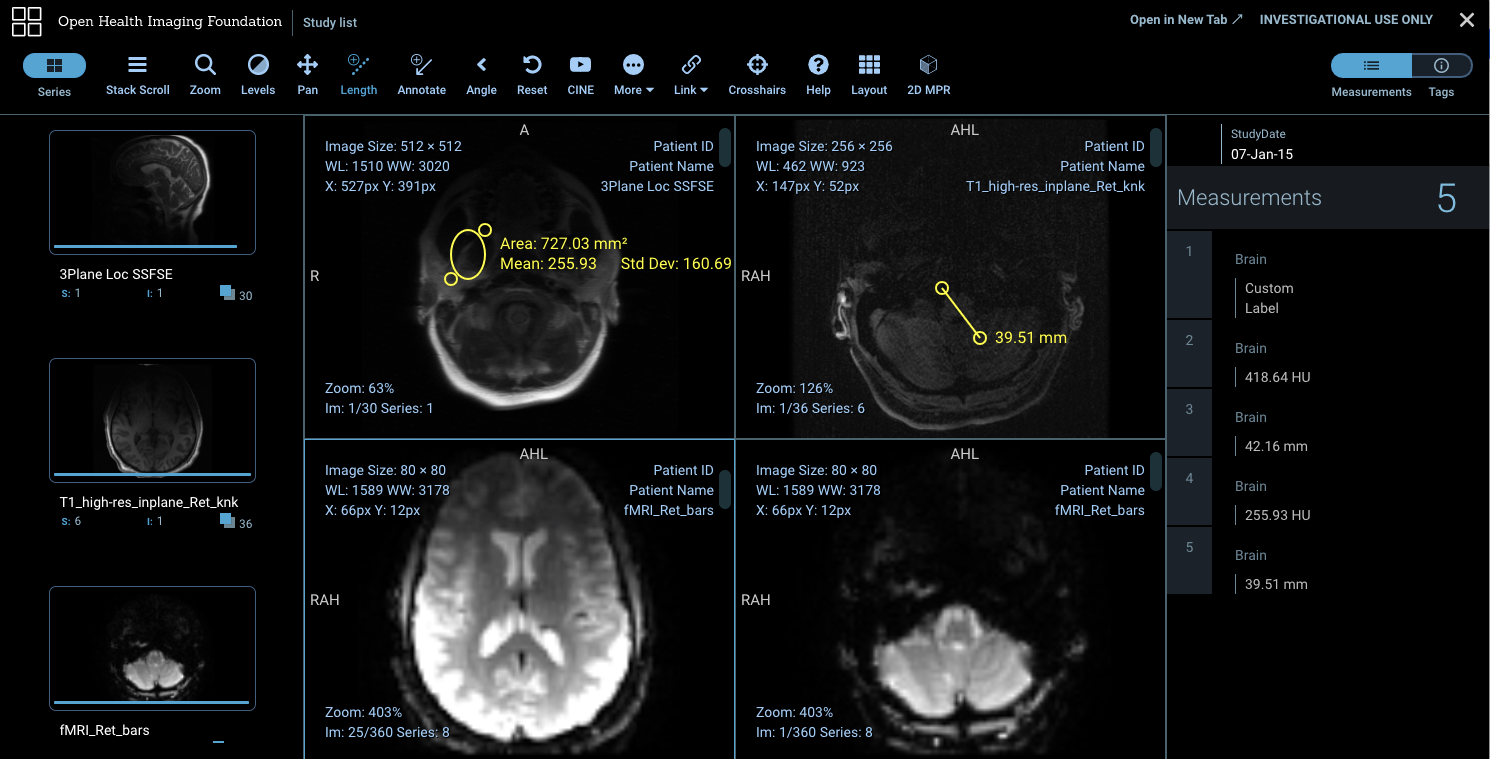
 2. Once a session is selected, the viewer opens and the sessions are grouped along the left menu. Use the up and down arrow keys or scroll to move through the images in the series. 3. Select the Layout tool to view more than one acquisition from that session at the same time.

Close the left or the right menu by deselecting it in the top toolbar
-
To view images from the same subject across sessions, select the Nav button. The following hierarchy should be displayed:
- Subject label
- Session ID
- Acquisition ID
- Session ID
- Navigate to the acquisition view you desire (an additional session can also be viewed).
- Subject label
 Subject label -> Session ID -> Acquisition ID
See below for more information on adding annotations, ROI, and measurements.
Toolbar and Default Keyboard Shortcuts
The toolbar offers a number of options for viewing or annotating images.
Your viewer may be configured to hide some of these tools, so your options may be different. Additionally, the hotkeys for your viewer may also have been changed.
See the OHIF Config file for more information about what you can customize.

Table 1. The Viewer Toolbar
| Tool | Description | Default hotkey or keyboard shortcut |
|---|---|---|
| Series | View series in the left menu | none |
| Nav | Navigate to a different session from the same subject. This allows you to view multiple sessions at the same time. | none |
| Layout | Add additional viewports and select their position | none |
| Stack Scroll | Navigates quickly on the stack of images by dragging up and down inside the viewport | s |
| Zoom | Zoom or Magnify the region of the image under the pointer | z or m |
| Levels | Changes the window width or window center by swiping horizontally or vertically. | none |
| Invert | Inverts the colors of the image in the active viewport | i |
| Pan | Allows navigating on the image by dragging | p |
| ROI | ||
| Manual Rotate | Rotates the image in the active viewport | None |
| Ellipse | Draws an ellipse with measurements and allows you to choose a label | None |
| Rectangle | Draws a rectangle with measurements and allows you to choose a label | None |
| ROI Window | Sets the window width/length of the viewport as the average value in the rectangular region | None |
| Freehand | Draws freehand region | None |
| Open Freehand | Draws an open-ended freehand annotation | None |
| Sculpt | Adjust a freehand ROI or open-freehand ROI | None |
| Eraser | Erases a selected measurement | None |
| Clear | Clears all current measurements | None |
| Measure | ||
| Length | Calculates the length between two points. Metadata about the results appear in the measurements panel. | None |
| Bidirectional | Draws two perpendicular lines with width and length. Metadata about the results appear in the measurements panel. | None |
| Freehand | Draws a freehand region. Metadata about the results appear in the measurements panel | None |
| Angle | Determines the smallest angle between three points. Metadata about the results appear in the measurements panel | a |
| Orient | ||
| Manual rotate | Rotates the image in the active viewport | None |
| Rotate right | Rotates the image 90 degrees | r (rotate right) l (rotate left) |
| Flip H | Flips the image in the active viewport horizontally | h |
| Flip V | Flips the image in the active viewport vertically | v |
| Annotate | Adds an arrow with custom text as annotation. Metadata about the results appear in the measurements panel | None |
| CINE | Shows playback dialog with finer controls for playing sequences | None |
| Probe | Determines the numeric image value under the cursor | None |
| Colormap | Colormap: Choose an image colormap | None |
| Segmentation | Loads segmentation overlays on to active NIFTI or DICOM viewports. | None |
| Link | Synchronizes different viewports on scroll, levels, or zoom Select a layout with more than one viewport to see this option | None |
| Crosshairs | Sync different slices of the same data | None |
| 2DMPR | Switch to 2D MPR viewer | d |
| Reset | Resets all modifications made to the current images viewport | None |
| Measurements | Displays any annotations, ROIs, or measurements along with more information on who added it and when. This is also where a study form appears if configured | None |
| Tags | Displays all DICOM tags and values for the image– including private DICOM tags. Flywheel looks up tags in a dictionary, if there is no match found, the viewer displays the offset for the label | None |
Additional Default Hotkeys
- ] - Next measurement tool
- [ - Previous measurement tool
- Right - Next viewport
- Left - Previous viewport
- Up- Scroll up
- Down - Scroll down
Define and Label ROIs
The steps for defining and labeling an ROI depends on which infrastructure your Flywheel site is using. The steps below describe how to do this on a V3 site. See below for adding an ROI on a V2 Site.
- Select the OHIF icon to open the viewer.
- Select ROI from the toolbar.
- Choose either Ellipse, Rectangle, or Freehand.
 4. Mark the ROI on the image.
The label picker appears. If you need different labels than what is included in the default list, you can create a customized list of label by editing the OHIF config file. See the OHIF Config article for more information.
- Choose a label.
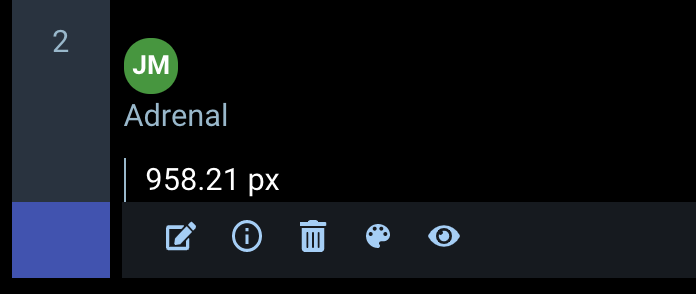
- The ROI details appear in the Measurements panel to the right. Click on the measurement details to change the color, edit the label, or delete the ROI.
 7. Click Save Measurements once you are satisfied.
Add an Annotation
- Navigate to the viewer by selecting the OHIF icon .
- Click Annotate
- Add your annotation to the image, and select a label.
The label picker appears. If you need different labels than what is included in the default list, you can create a customized list of label by editing the OHIF config file. See the OHIF Config article for more information. - The annotation details appear in the Measurements panel to the right. Click on the measurement details to change the color, edit the label, or delete.
5. Click Save Measurement.
Add a Measurement
- Navigate to the viewer by selecting the OHIF icon .
- Click Measurement, and choose one of the tools.
- Select the areas of the image you wish to measure.
The label picker appears. If you need different labels than what is included in the default list, you can create a customized list of label by editing the OHIF config file. See the OHIF Config article for more information. - Choose a label.
- The measurement details appear in the Measurements panel to the right. Click on the measurement details to change the color, edit the label, or delete.
6. Click Save Measurement.
Add Segmentation Masks
Before you can add a segmentation to the image, you must create the segmentation masks. For example, when you run the Freesurfer gear, segmentation masks are part of the analysis output. To add segmentation:
- Click Segmentation in the toolbar.
- Click Load Mask.
- Navigate to the mask file.
If you ran a Gear such as FreeSurfer: run recon-all, the mask will be under the acquisition file. - If you have more overlays you wish to add, repeat steps 1–3.

- You can adjust the opacity of each segmentation or rearrange the order the segmentations as needed.
- Click Download in the toolbar to download the image with the overlays.
Steps for V2 Platforms
Add ROI
- Sign in to Flywheel.
-
Navigate to an Acquisition:
- Click Projects.
- Choose a Project from the list
- Click the Sessions tab.
4. In Acquisitions, hover over an acquisition. 5. Select the OHIF icon  . 3. Select ROI from the toolbar. 4. Choose either Ellipse, Rectangle, or Freehand. 5. Choose a label, and enter a description.
ROIs and Labels are applied per slice. Labels and descriptions appear on the right-hand side.
 6. Click Save to Archive.
The ROI and label are saved as custom metadata.