Usage Report
The Flywheel Usage Report provides a way for Site Admin users to inspect the utilization of the Flywheel Site and per project, over a given time range. The report data is intended to help customers understand how each project's utilization is contributing to consumption-driven costs.
Usage Report (Web UI)
The Usage Report page in the Flywheel Web UI displays site utilization data over a selected date range. To open it, select Usage Report under the Reporting section of the Flywheel sidebar.
The page has two tabs:
- Dashboard — an at-a-glance visual overview of utilization trends.
- Report — a detailed, filterable, and exportable table.
Changed in version 22.3.0
The Usage Report was redesigned to separate an at-a-glance Dashboard from a detailed Report tab. The Dashboard adds trend charts for file count, content size, and gear run time, with breakdowns by group. The Report tab adds grouping by group (in addition to project and month), a filter panel, and the ability to save filter selections for reuse. The table now shows the end-of-range value for each metric alongside the change over the period. The Storage metric was renamed content size.
Metrics
The Dashboard and Report present the same core metrics:
- File Count and Content Size both describe your managed project files: every available version of every file attached to every project, subject, session, acquisition, and analysis. Managed project files include Smart Copy files and ref-in-place imported files, but not soft-deleted files, backups, or snapshots. File count is the number of these files (each version counts as one); content size is their combined size.
- Gears Run is the number of gear jobs run, and Gear Time is the total gear compute time, over the selected period.
Logical Usage, Not Physical Storage
File count and content size are logical measures, not the physical storage resources your deployment actually utilizes. The infrastructure storage utilized for your site will therefore differ from the content size shown in the Usage Report.
Records Under Management Licensing
File count is the measure for your licensed tier of Records Under Management. Records Under Management licensing does not apply to all service agreements. Review your Flywheel service agreement or contact your Flywheel account representative with questions.
Deleted Groups
When a group has been deleted its label is no longer available. The Dashboard month hover tooltip, the Dashboard chart legend, and the Group column of the Report table display the group identifier followed by (deleted), for example neuro_lab (deleted). The CSV download reports <Deleted Group> in the group_label column and the group identifier in the group_id column.
Before version 22.5.0, the Dashboard and the Report displayed <Deleted Group> in place of the group name, and only the CSV download included the group identifier.
Dashboard
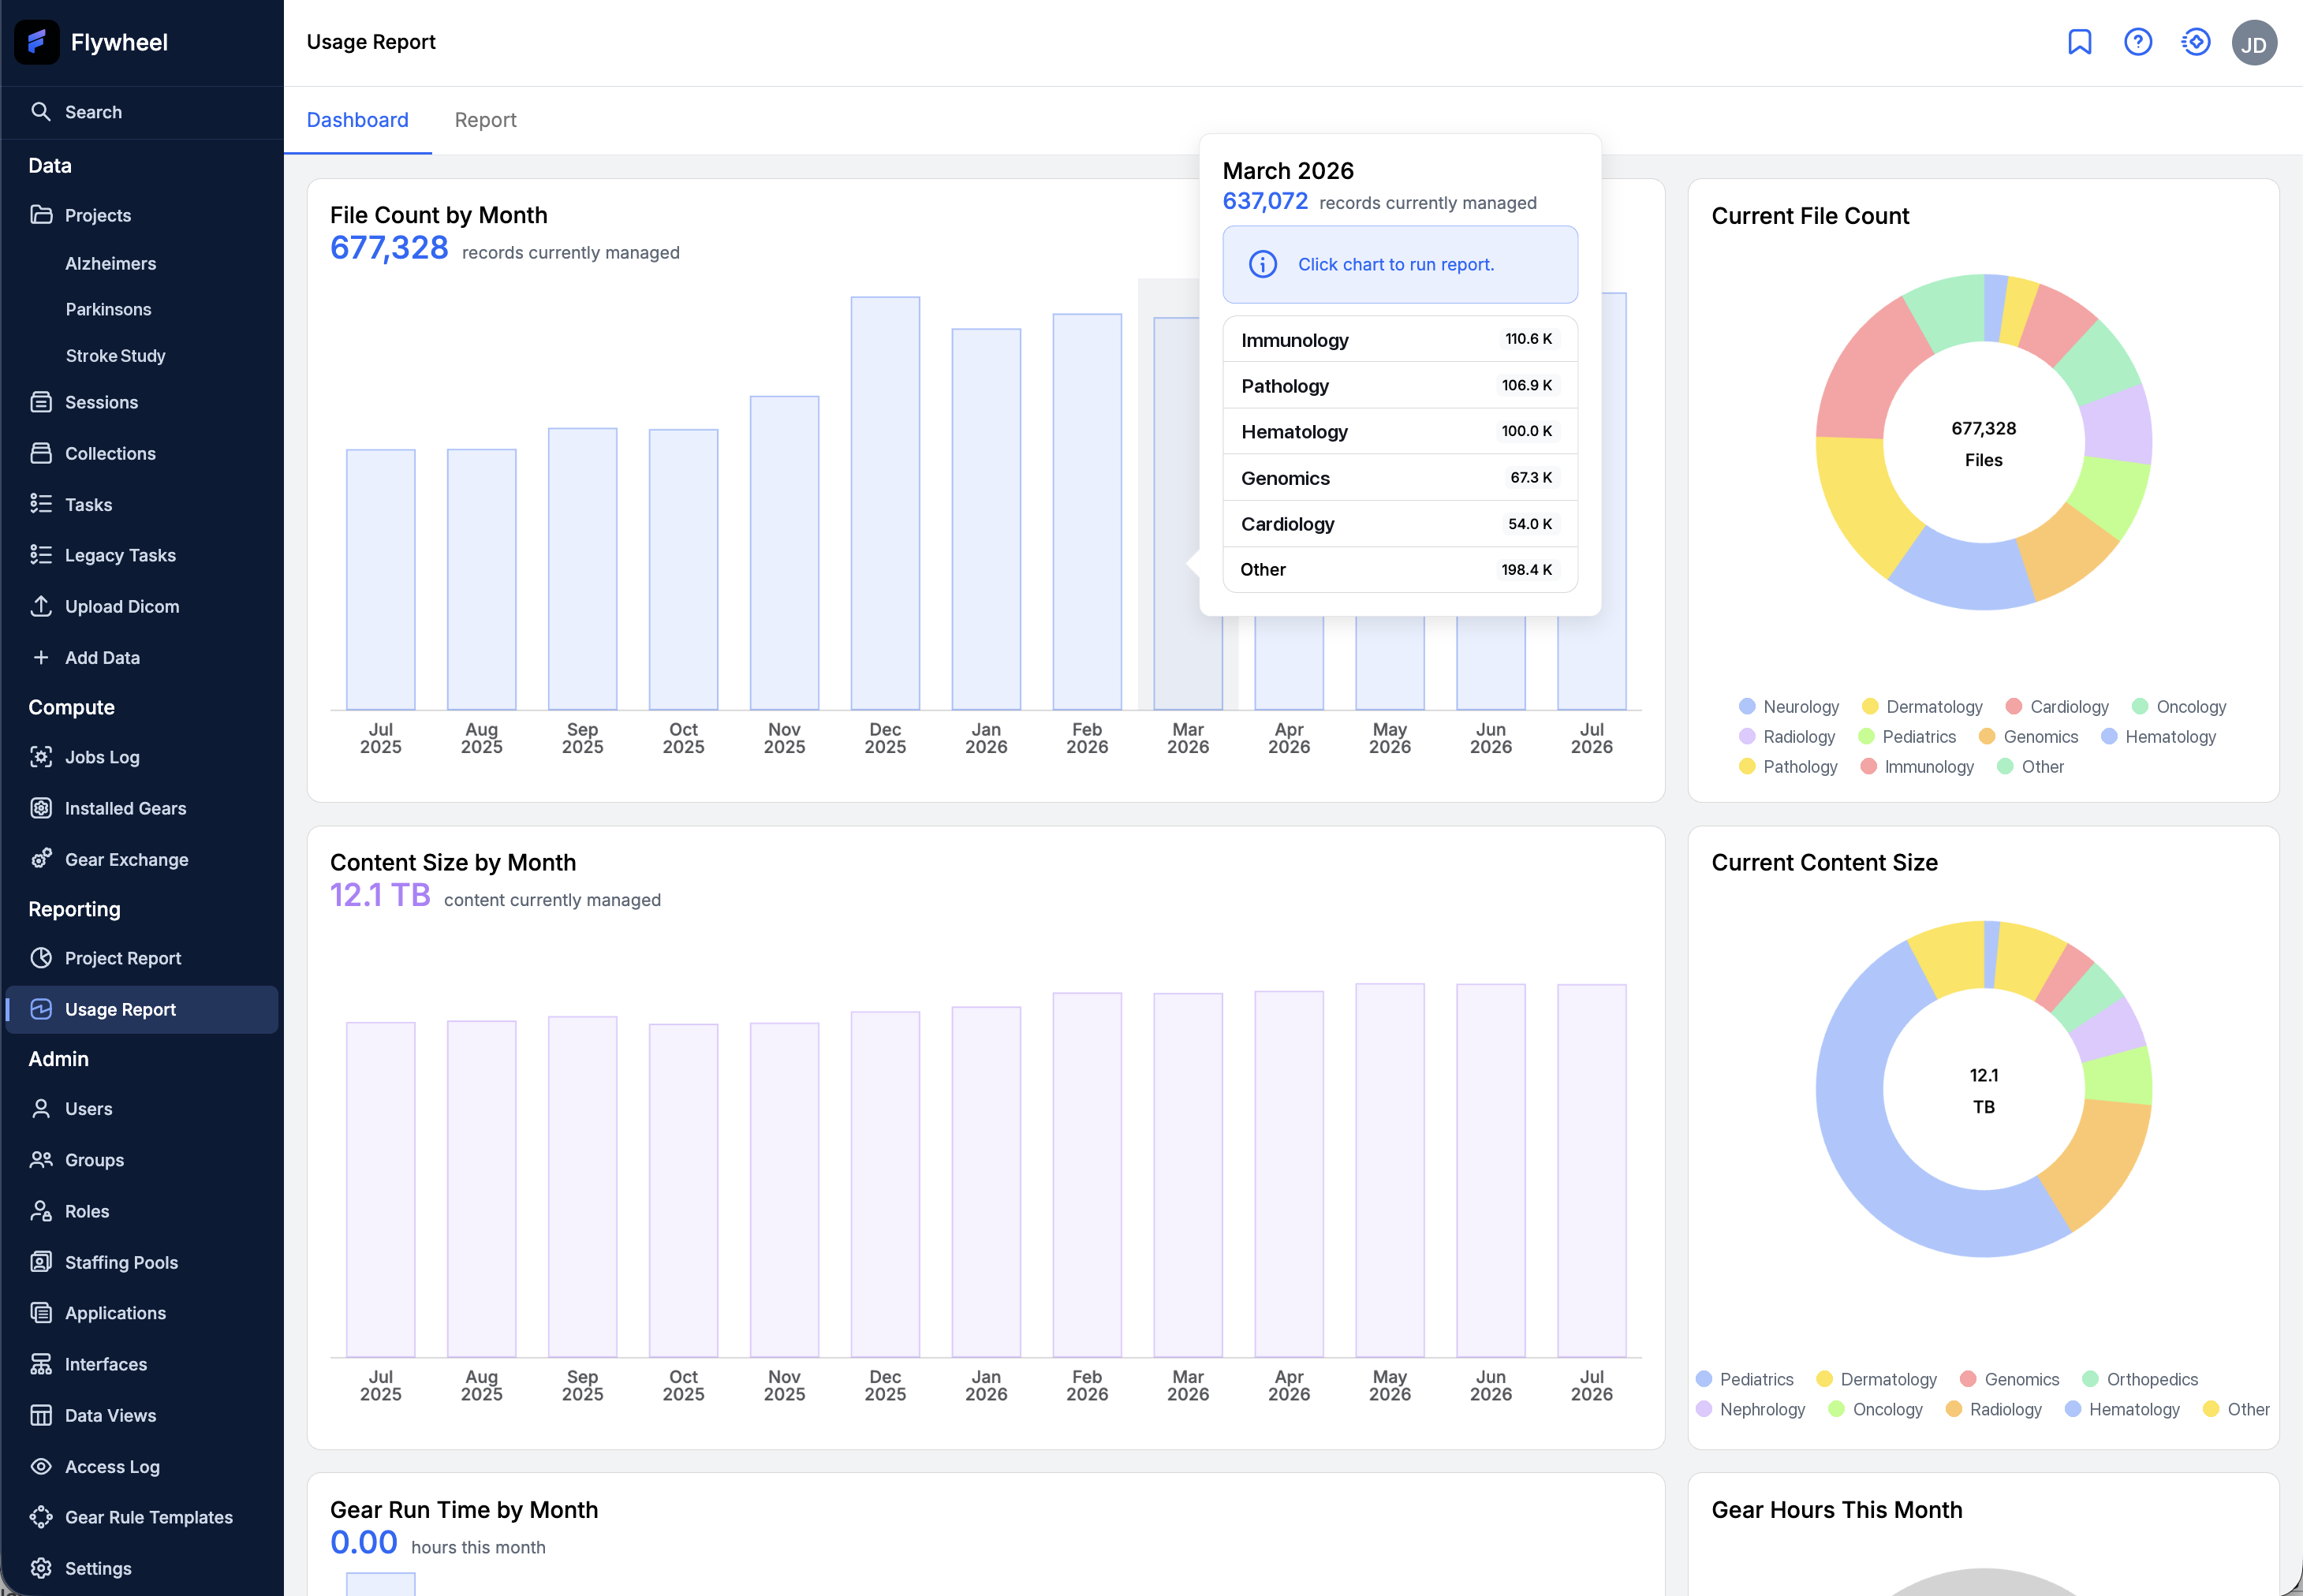
The Dashboard tab provides a visual overview of how your site's utilization has changed over time. It includes:
- File Count by Month and Content Size by Month — bar charts showing the trend in file count and content size over recent months.
- Gear Run Time by Month — a bar chart showing gear compute time over recent months.
- Current File Count, Current Content Size, and Gear Hours This Month — doughnut charts that break down the current totals by group.
Hovering over a monthly bar shows that month's value along with a breakdown of the top five groups for that metric. Clicking a monthly bar opens the Report tab pre-filtered to that specific month.
Report
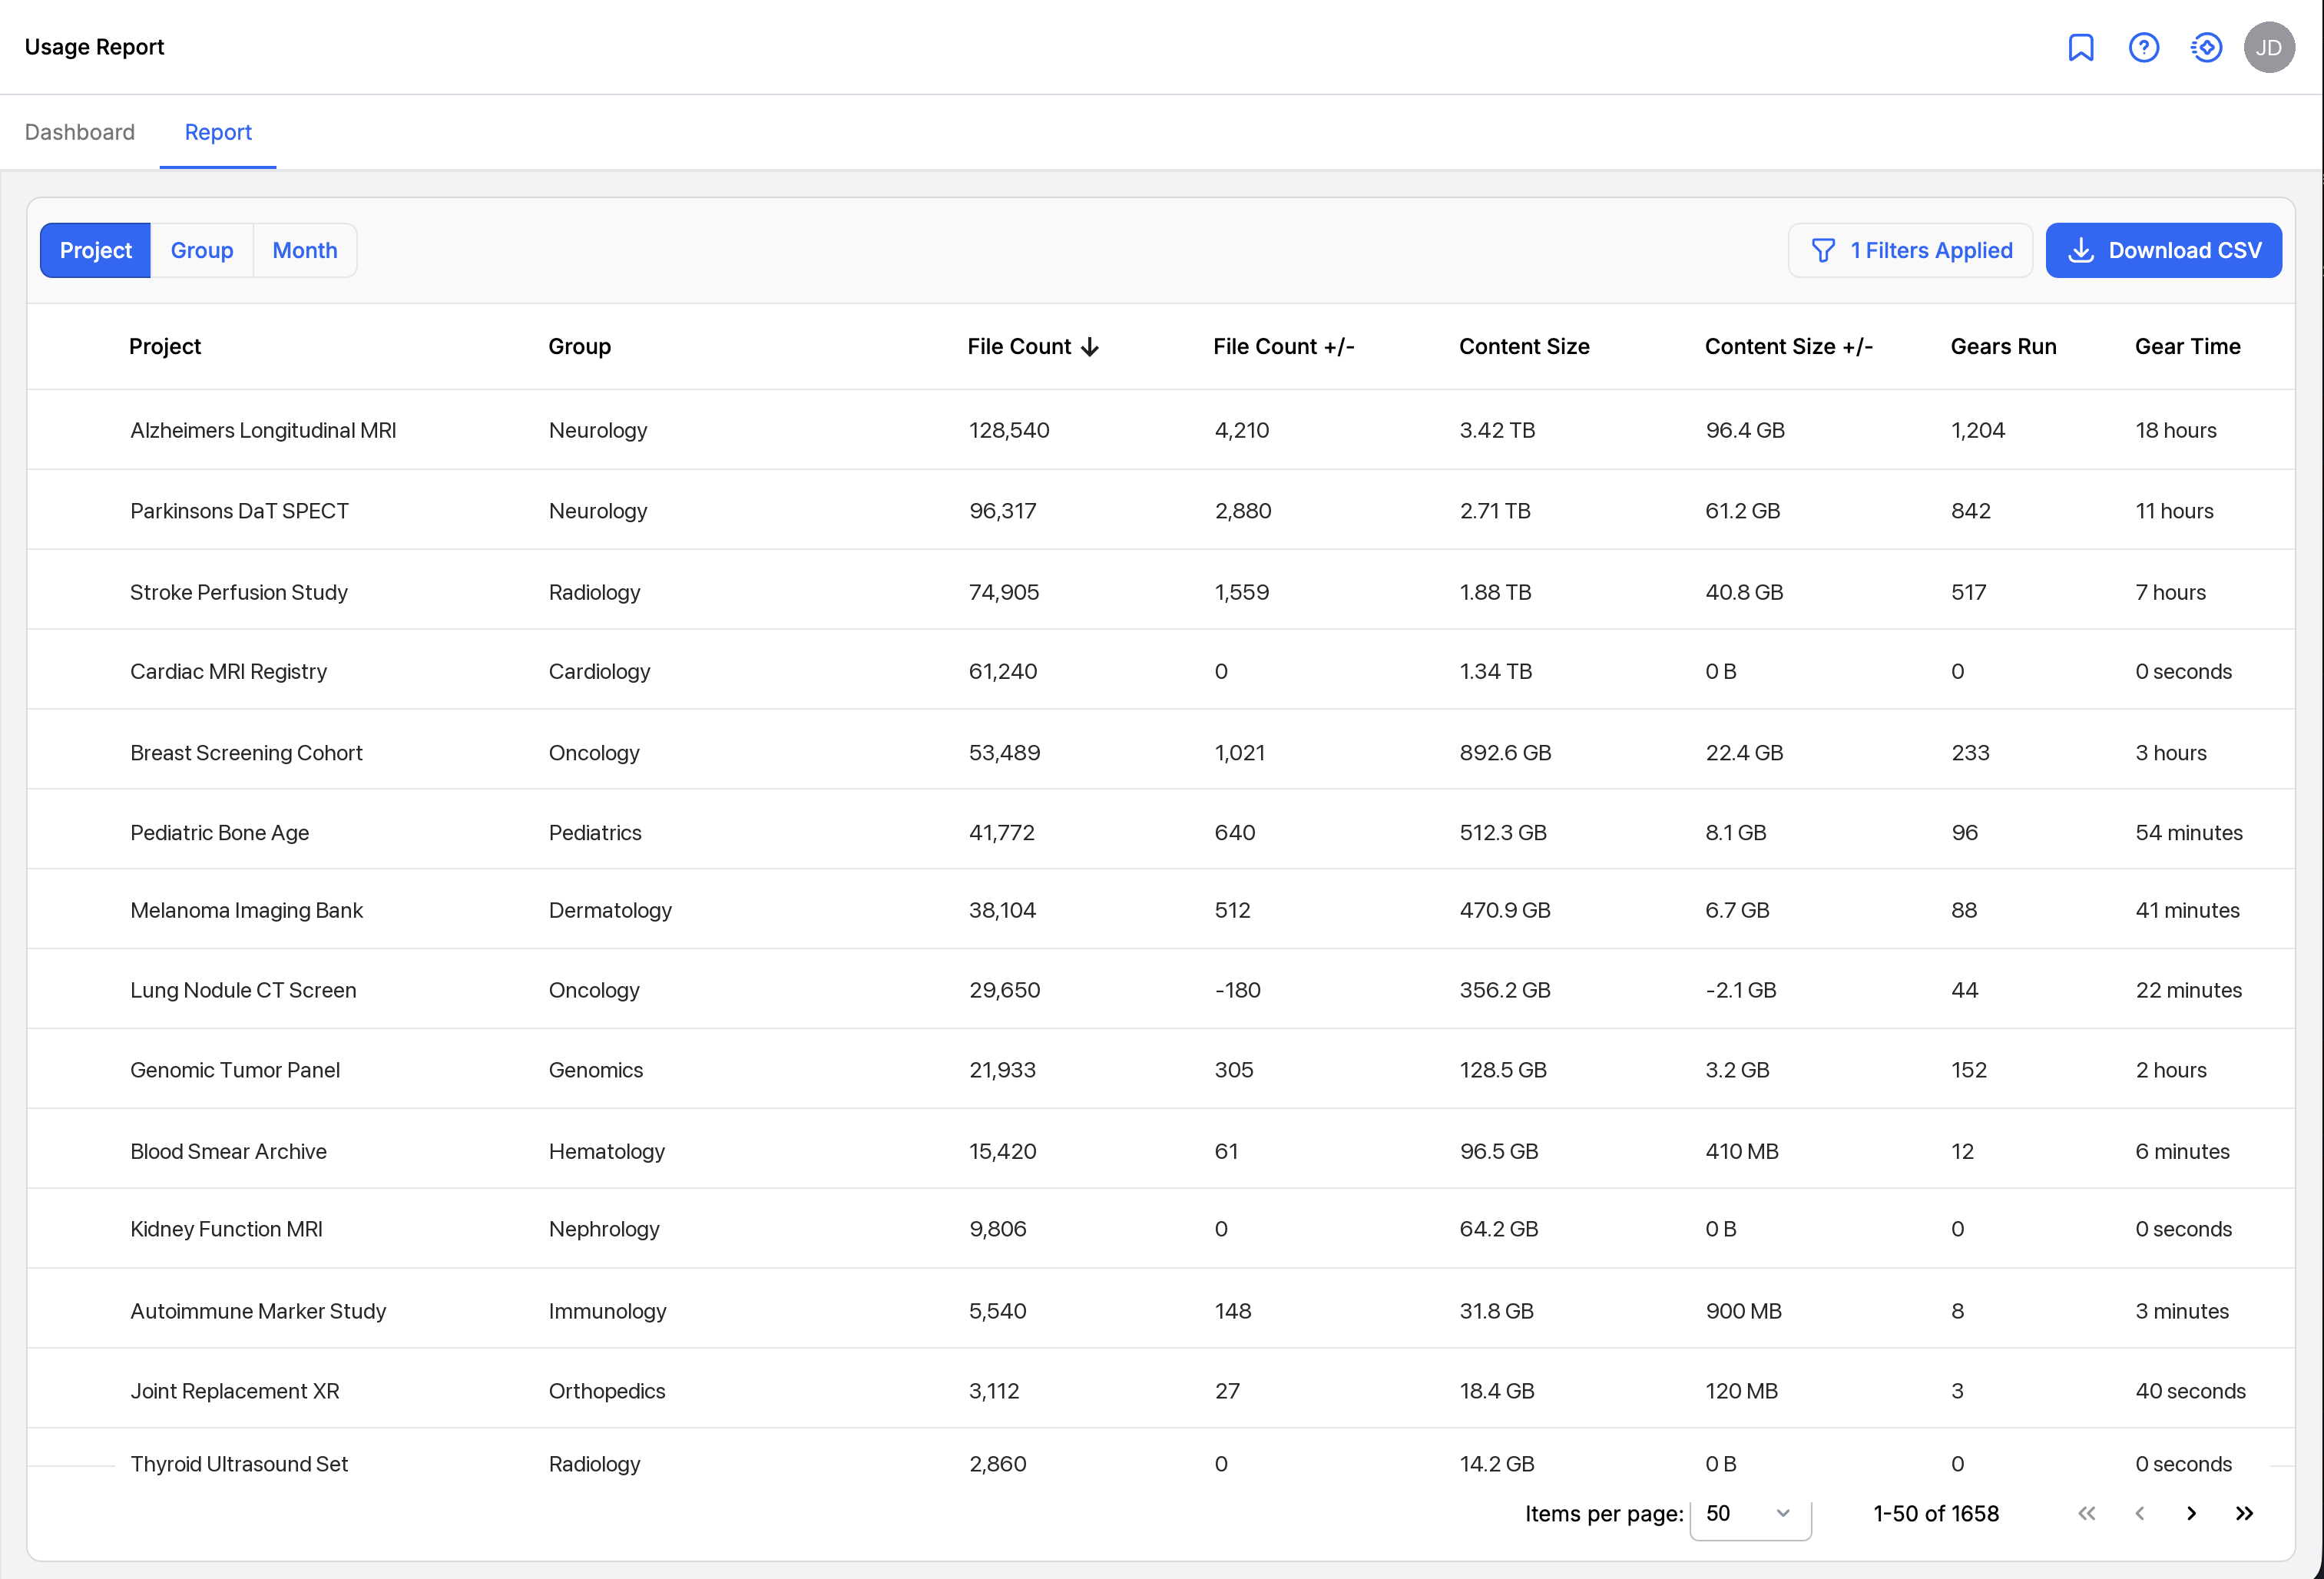
The Report tab displays site utilization data in a detailed, sortable table over a selected date range. A report for the current month runs automatically when the page opens.
For file count and content size, the table shows both the value at the end of the selected range and the change over that range in a separate +/- column:
| Column | Description |
|---|---|
| Project | The project name (shown when grouping by project) |
| Group | The parent group (shown when grouping by project or group) |
| Month | The reporting month (shown when grouping by month) |
| File Count | The number of managed project files at the end of the date range |
| File Count +/- | The change in file count over the date range |
| Content Size | The combined size of managed project files at the end of the date range |
| Content Size +/- | The change in content size over the date range |
| Gears Run | The total number of gear jobs run during the date range |
| Gear Time | The total gear compute time during the date range |
Grouping the Report
Use the Project, Group, and Month toggle at the top of the tab to choose how the data is grouped:
- Project — one row per project, with its parent group
- Group — one row per group
- Month — one row per month
Filtering the Report
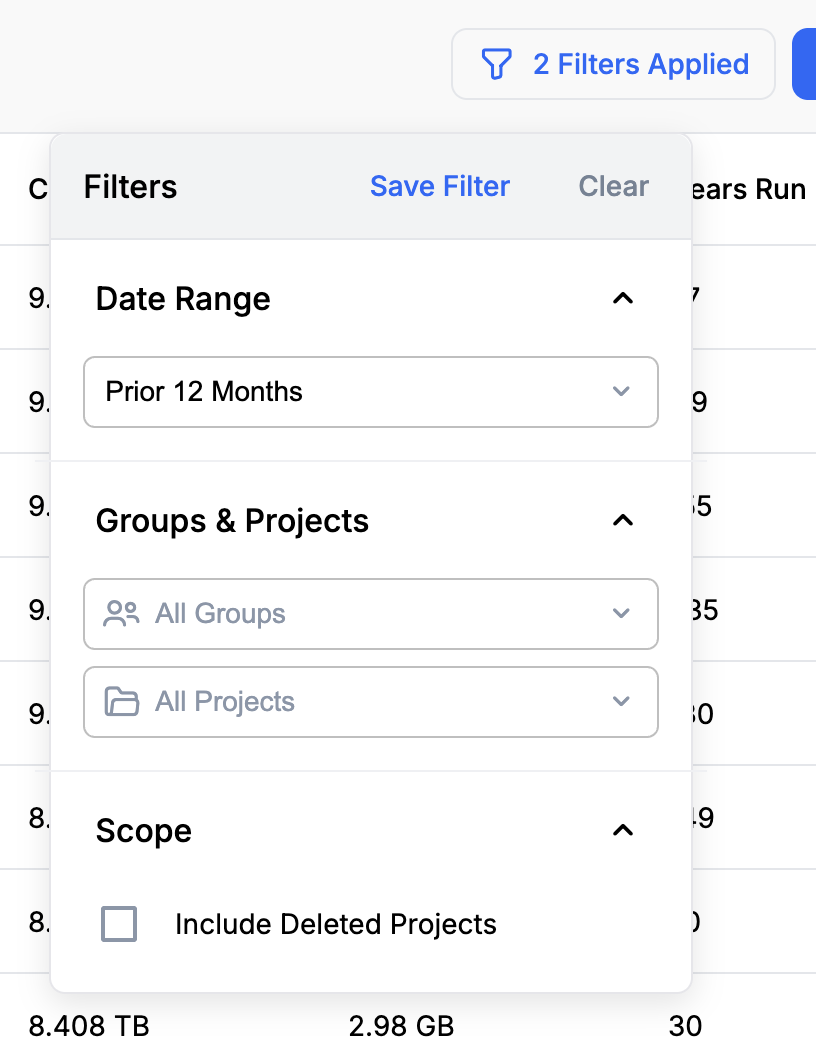
Select the filter button (labeled with the number of filters applied) to open the filter panel, which provides the following options:
- Date Range — one of the predefined ranges: Current month, Prior month, Prior 3 months, Prior 6 months, or Prior 12 months.
- Groups & Projects — limit the report to a single group and/or project. Defaults to All Groups and All Projects.
- Scope — select Include Deleted Projects to include projects that have been deleted.
Select Save Filter to save the current filter selections so you can reapply them later without configuring them again, or Clear to reset all filters.
Downloading Report Data as CSV
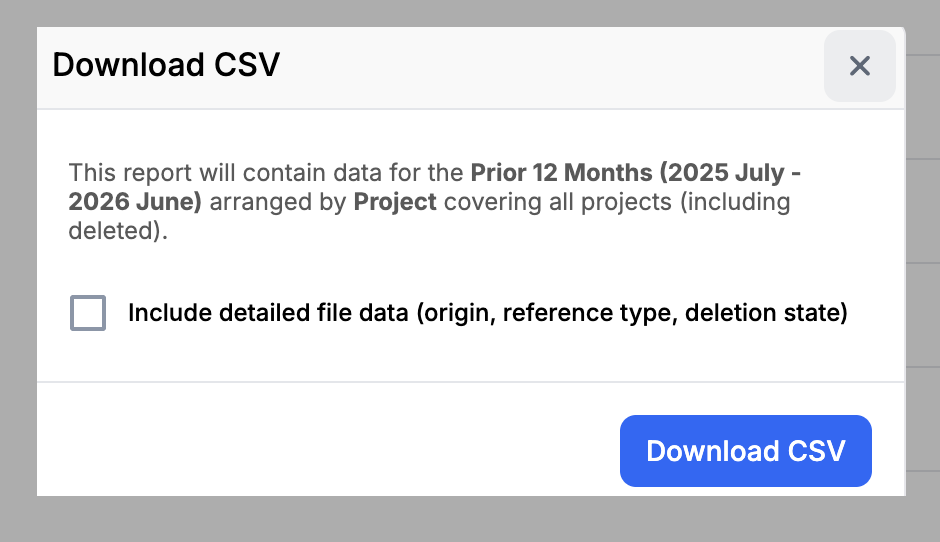
You can download the report data as a CSV file by selecting the Download CSV button on the Report tab. A dialog summarizes the report scope — the date range, how the data is grouped, and that all projects, including deleted ones, are covered — and offers one option:
- Include detailed file data (origin, reference type, deletion state) — when selected, the CSV adds the detailed file count columns described below. When cleared, the CSV contains only the standard columns.
Like the Report table, the CSV reports each metric as a change over the period (a _delta column) and a value at the end of the period (an _end column). The CSV differs from the Report table in two ways:
- Always includes deleted projects: The CSV includes data for deleted projects regardless of the Include Deleted Projects filter, which controls only whether they appear in the Report table.
- Optional detailed file data: When you select Include detailed file data, the CSV adds a breakdown of file counts by storage type, origin, and deletion status (described below).
When you download without detailed file data, the CSV contains the following standard columns. The Included column indicates which groupings each column appears in:
| Column | Included | Description |
|---|---|---|
error | Always | Error message, if any, encountered when gathering data for the row |
project_label | Project grouping | The project name |
project_id | Project grouping | The unique project identifier |
group_label | Project or group grouping | The group name. Appears as <Deleted Group> for a deleted group. |
group_id | Project or group grouping | The unique group identifier |
project_deleted | Project grouping | Whether the project has been deleted (True or False) |
month | Month grouping | The month of the reporting period |
year | Month grouping | The year of the reporting period |
period_start | Always | The start date of the reporting period |
period_end | Always | The end date of the reporting period |
files_total_managed_count_delta | Always | The change in the count of managed project files over the period |
files_total_managed_count_end | Always | The count of managed project files at the end of the period |
session_count_delta | Always | The change in session count over the period |
session_count_end | Always | The number of sessions at the end of the period |
managed_data_bytes_delta | Always | The change in the combined size (in bytes) of managed project files over the period |
managed_data_bytes_end | Always | The combined size (in bytes) of managed project files at the end of the period |
job_count_sum | Always | The total number of gear jobs run during the period |
compute_ms_sum | Always | The total gear compute time in milliseconds during the period |
Detailed file data columns:
The following columns are appended only when you select Include detailed file data (origin, reference type, deletion state) in the download dialog. Each metric appears as a pair: a _delta value (the change over the period) and an _end value (the count at the end of the period).
Warning
The detailed file data columns included in the CSV download, their names, and their order are subject to change in future releases. Any automated processing of the CSV should identify columns by their heading, not by position.
Column (with _delta / _end suffix) | Description |
|---|---|
files_source_original_count | Files with their own storage (excludes Smart Copy and ref-in-place files) |
files_source_by_ref_count | Files that reference another file's storage (Smart Copy and ref-in-place imports). This plus files_source_original_count equals the total managed file count. |
files_deleted_soft_count | Files deleted by a user or API call but still retained on storage, allowing recovery. For example, a DICOM series deleted from a session in the UI. |
files_deleted_hard_count | Files permanently removed from storage and cannot be recovered. Files are hard-deleted when purged after the site's configured retention period for soft-deleted data. |
files_origin_user_count | Files created by direct user action, including uploads through the UI, CLI, or SDK, as well as files written by API-enabled gears that a user launched. |
files_origin_job_count | Files uploaded by the compute engine on behalf of a gear job. Most gear output files fall into this category regardless of how the job was triggered. |
files_origin_device_count | Files received from an external device connector. For example, DICOM images sent from a scanner or PACS. |
files_origin_user_workspace_count | Files saved from a user workspace session. For example, a Jupyter notebook saved from JupyterHub. |
files_origin_system_count | Files created by internal Flywheel platform operations. These counts are typically zero. |
files_origin_gear_rule_count | Files written directly by an API-enabled gear that was triggered by a gear rule. |
files_origin_task_count | Files created by Flywheel background tasks that support core platform services. These counts are typically zero. |
files_origin_unknown_count | Files whose origin was not recorded. Typically older files that predate origin tracking. |
The CSV contains one row per project when grouped by project, one row per group when grouped by group, and one row per month when grouped by month.
Usage Report (Daily/Monthly APIs)
A set of usage reporting APIs are available via the Flywheel Python SDK. These APIs support querying usage data by month or day, as well as by group or project. This report reflects the full totals for each day, rather than only the net-new change. Every night an automated background process collects and preserves usage data to support the largest Flywheel sites and more use cases.
For example: If 1 TB of data was added to Project A, then on different days moved to Project B, then deleted, that rise and fall of 1 TB of data in both projects would be possible to see in this report.
This also makes it possible to view historical usage for deleted projects.
Soft-Deleted Stats
The 19.4.0 release of Flywheel added soft-deleted data stats to this usage report.
- Soft-deleted files are files that have been deleted by a user or device and are no longer available via Flywheel user interfaces and APIs, but whose contents still exist on storage, making recovery possible.
- You can use the soft-deleted stats to understand how much deleted data may still be consuming infrastructure storage capacity.
- Flywheel SDK 19.4.0 or later is required to access the soft-deleted stats.
- It may take up to a week after your Flywheel site is upgraded to 19.4.0 for the system to complete the collection of historical stats.
SDK Documentation
Flywheel Python SDK documentation is available for both the daily and monthly versions of this report.
Legacy Usage Report API
The Legacy Usage Report API was previously used by the Flywheel Web UI. As of version 21.5.0, the Web UI uses a newer, more efficient API and no longer relies on the Legacy Usage Report API.
The Legacy API is still accessible via the Python SDK get_legacy_usage_report method.
Deprecated
The Legacy Usage Report API is deprecated and is scheduled to be removed in the Flywheel 23.0.0 release (October 2026). See the deprecation notice for migration guidance.
Comparing Capabilities
| Report Capability | Web UI | CSV Download | Daily/Monthly SDK | Legacy API |
|---|---|---|---|---|
| Net new sessions and content size over time range? | yes | yes | yes | yes |
| Data available for usage from the current day? | no | no | no | yes |
| Data available for usage from yesterday and prior days? | yes | yes | yes | yes |
| Specifies the project's parent group? | yes | yes | yes | no |
| Total sessions per project for a given day? | no | yes | yes | no |
| Includes deleted projects? | yes | yes | yes | no |
| Counts Smart Copy files? | yes | yes | yes | yes |
| Counts ref-in-place imported files? | yes | yes | yes | yes |
| Aggregate file count for the date range? | yes | yes | no | no |
| File counts by storage type (source), origin, and deletion status? | no | yes | no | no |
| Counts soft-deleted data? | no | no | yes | no |
| Separation of usage by Center vs. Lab for Multi Provider customers? | no | no | yes | no |
| Supports sites with millions of files and thousands of projects? | yes | yes | yes | no |
| Gear job count and compute time? | yes | yes | yes | no |